
Table of Contents
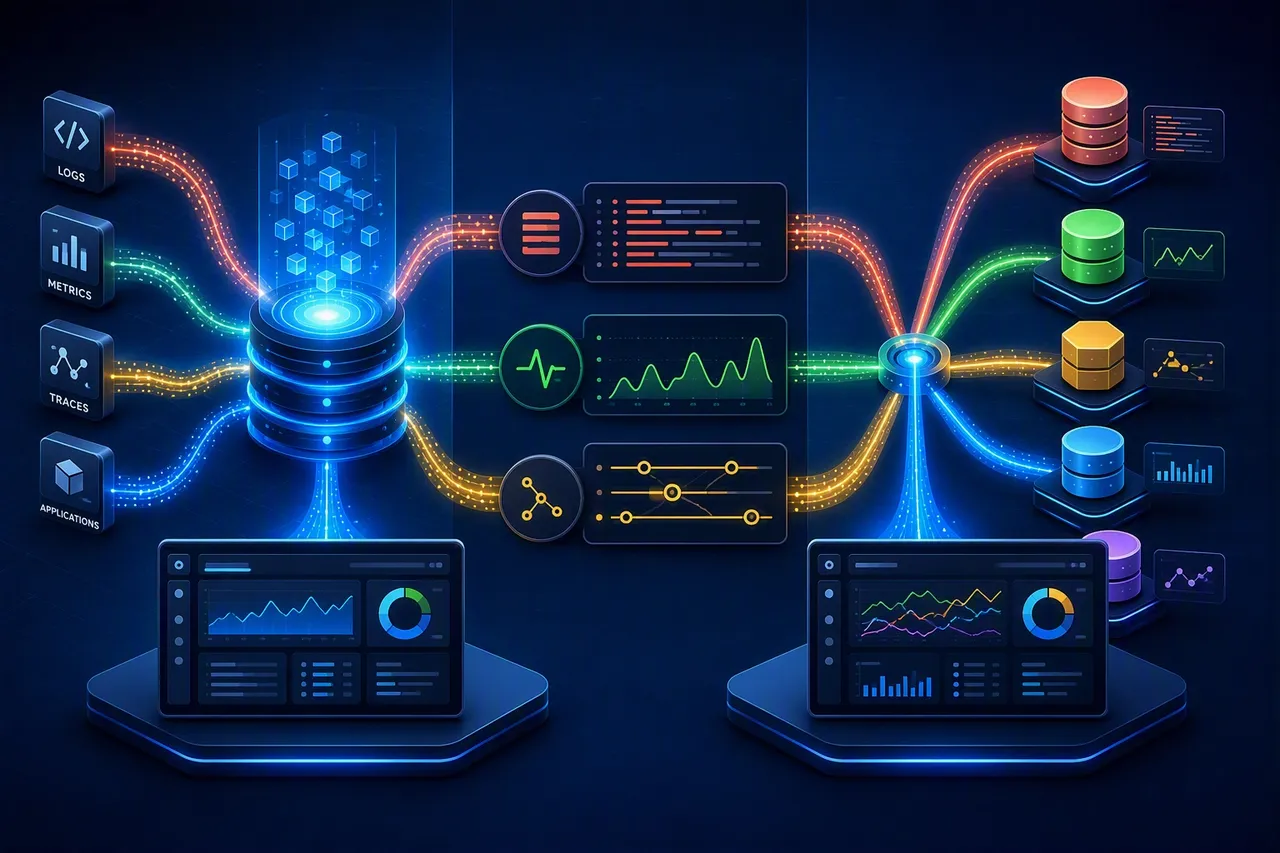
Choosing between Kibana vs Grafana is primarily an observability architecture decision, not a question of which platform creates better-looking dashboards. Both can support logs, metrics, traces, dashboards, and alerting, but they approach telemetry from different directions.
Kibana is tightly integrated with Elasticsearch and the broader Elastic ecosystem, making it a natural fit when operational data is centralized in Elasticsearch. Grafana is designed around a multi-data-source model, allowing teams to query monitoring systems such as Prometheus, Elasticsearch, Loki, and tracing backends from a common interface. The right choice therefore depends on where your telemetry lives, how your engineers investigate incidents, and how much you want to standardize around a single observability ecosystem.
Key Takeaways
- Elasticsearch-centered stacks: Kibana provides the tightest experience when Elasticsearch is already the main operational data platform.
- Multi-source observability: Grafana is designed to query multiple independent data sources from a common interface.
- Prometheus environments: Grafana includes a preinstalled Prometheus data source, while Elastic can ingest Prometheus metrics into Elasticsearch for analysis in Kibana.
- Logs, metrics, and traces: Neither platform should be reduced to “Kibana for logs” or “Grafana for metrics”; both can participate in full-stack observability.
- Final choice: Existing telemetry architecture, investigation workflows, deployment requirements, security needs, and cost model should drive the decision.
Kibana vs Grafana: What Is the Core Difference?
Kibana is the interface for working with data stored in Elasticsearch. It combines search, exploration, visualization, dashboards, alerting, and management capabilities around the Elastic data platform. Grafana takes a different approach: it connects to multiple storage and monitoring backends and provides dashboards, exploration, and alerting across those sources.
The practical distinction is therefore centralized Elastic workflows versus multi-source observability. Kibana tends to fit most naturally when Elasticsearch already serves as the operational data platform. Grafana becomes especially useful when telemetry remains distributed across systems such as Prometheus, Elasticsearch, Loki, Tempo, cloud monitoring services, or SQL databases.
Logs, Metrics, and Traces
Logs, metrics, and traces are core observability signals, and both ecosystems support all three. The bigger difference is where the telemetry is stored and how it is explored. Kibana works with observability data indexed in Elasticsearch, while Grafana can query different backends for different signals and combine them in dashboards and investigation workflows.
| Signal | Kibana | Grafana |
|---|---|---|
| Logs | Search and analyze logs stored in Elasticsearch through Discover and other Elastic Observability workflows | Query logs from supported backends such as Loki or Elasticsearch |
| Metrics | Explore metrics stored in Elasticsearch, including time-series data | Query Prometheus and many other metrics backends |
| Traces | Explore trace/APM data stored in Elastic | Query supported tracing backends such as Tempo and Jaeger |
Elasticsearch, Prometheus, and Data Sources
The biggest architectural difference appears in how the platforms connect to telemetry. Kibana works with data stored in Elasticsearch, so teams typically ingest or send their logs, metrics, and traces into Elastic before exploring them through Kibana. Elastic provides hundreds of integrations and also supports Prometheus metrics through exporters, Prometheus queries, and remote-write workflows.
Grafana instead connects directly to supported data sources. Its Prometheus data source is preinstalled, and its Elasticsearch data source can query logs and metrics stored in Elasticsearch. This makes Grafana particularly useful when a team wants to retain different observability backends while presenting them through one interface. In Grafana 13, the Elasticsearch data source is packaged as a standalone, preinstalled plugin that can be updated independently of Grafana releases.
Dashboards, Querying, and Investigation
Kibana’s investigation workflow is closely tied to Elasticsearch. Discover is used to search, filter, and inspect underlying data, while Lens and dashboards turn that data into visualizations. Engineers can use KQL for filtering and ES|QL for piped querying, transformation, aggregation, visualization, and supported alerting workflows.
Grafana’s Explore interface is designed for ad-hoc investigation across configured data sources. The query language depends on the backend: Prometheus uses PromQL, for example, while the Elasticsearch data source supports Lucene queries, Elasticsearch Query DSL, and ES|QL. Grafana variables and transformations can then help engineers build reusable dashboards and correlate information across sources.
Alerting
Both platforms provide integrated alerting, but their workflows reflect their architectures. Kibana offers ready-made rule types for Elastic applications such as APM, metrics, security, and uptime monitoring, alongside query-driven options including ES|QL-based alerting. Notifications can be routed through supported actions and external channels.
Grafana Alerting can create Grafana-managed rules across supported data sources and can also work with data-source-managed rules in systems such as Prometheus. Elasticsearch can be used as an alerting source in Grafana, although not every Elasticsearch query type is supported for alert evaluation. For example, current Grafana documentation notes that Elasticsearch log queries cannot directly be used as alert queries, while time-series metric queries are supported.Continuous monitoring is also an important part of broader software development best practices, helping teams turn observability signals into faster feedback and more reliable production systems.
Deployment, Scalability, Security, and Extensibility
Deployment and Hosting
Elastic supports multiple deployment models: self-managed Elastic Stack deployments, Elastic Cloud Hosted, and Elastic Cloud Serverless. Grafana can similarly be self-hosted through Grafana OSS or Enterprise, or consumed as the managed Grafana Cloud service. The operational burden therefore depends less on the dashboard tool itself and more on the chosen deployment and telemetry-storage architecture. These decisions are also closely tied to the wider cloud application development model, including whether applications run in public, private, hybrid, containerized, or cloud-native environments.
Scalability Models
Kibana and Grafana can both scale horizontally, but neither should be evaluated independently of its backend. Self-managed Kibana can run multiple instances behind a load balancer while Elasticsearch scales according to ingestion, retention, and query requirements. Grafana high availability similarly uses multiple Grafana servers behind load balancing, with a shared MySQL or PostgreSQL database for persistent application state. The storage systems supplying telemetry may require their own independent scaling strategy. Those infrastructure decisions should be evaluated as part of the broader web application architecture, particularly when applications must scale independently across services, databases, and cloud infrastructure.
Security and Access
Both ecosystems provide access controls, but feature availability varies by edition. Elastic’s free self-managed tier includes authentication and RBAC, while paid subscriptions add capabilities such as advanced SSO, field- and document-level security, and audit logging. Grafana OSS provides basic roles plus dashboard and folder permissions, while granular RBAC, data-source permissions, SAML, and audit logging are available in Grafana Enterprise or Grafana Cloud.
Plugins and Integrations
Elastic emphasizes integrations that bring telemetry into Elasticsearch and tightly connect with the broader Elastic platform. Grafana emphasizes a data-source and plugin model, with built-in sources plus community and enterprise plugins for additional databases, services, panels, and applications. Its Elasticsearch integration is currently provided as a preinstalled data-source plugin.
Kibana vs Grafana Pricing and Licensing
Kibana and Grafana both have free self-managed options, but their commercial pricing depends heavily on deployment model. Elastic offers a free self-managed tier alongside paid Platinum and Enterprise subscriptions. For managed deployments, Elastic Cloud Hosted uses resource-based pricing, while Elastic Cloud Serverless uses usage-based pricing. Observability Serverless costs are primarily tied to telemetry ingest and retention.
Grafana OSS is available under the AGPLv3 license. Grafana also offers commercially licensed Grafana Enterprise for self-hosted environments and Grafana Cloud as a managed service. Grafana Cloud includes a free tier and paid plans whose costs can include active users and product-specific telemetry consumption. Because both ecosystems combine software, storage, telemetry volume, retention, and operational costs differently, neither should be presented as universally cheaper.
Decision Matrix: When to Choose Kibana vs Grafana
When evaluating kibana vs grafana, your decision hinges on existing infrastructure and telemetry needs. This matrix helps teams choose between kibana software and a kibana alternative based on specific operational scenarios, comparing grafana vs kibana capabilities.
| Requirement | Choose Kibana When | Choose Grafana When |
|---|---|---|
| Elasticsearch-centered stack | Elasticsearch is already your central telemetry/search platform | You want Elasticsearch data alongside other independent sources |
| Prometheus monitoring | You plan to ingest Prometheus metrics into Elastic for centralized analysis | You want to query Prometheus directly through its preinstalled data source |
| Multi-source observability | You prefer centralizing telemetry in Elastic | You want one interface querying multiple independent backends |
| Log investigation | Logs are stored in Elasticsearch and deep search/investigation is important | Logs are spread across Loki, Elasticsearch, or other supported sources |
| Metrics dashboards | Metrics are already stored in Elastic | Prometheus or multiple metrics systems are central to monitoring |
| Distributed tracing | You use Elastic APM/OpenTelemetry telemetry stored in Elastic | You use supported tracing backends such as Tempo or Jaeger |
| Existing Elastic investment | You already operate Elasticsearch/Elastic Observability extensively | You need an additional cross-source dashboard layer |
| Heterogeneous monitoring stack | You are willing to ingest or centralize telemetry into Elastic | You want to retain separate monitoring backends |
| Managed cloud preference | Elastic Cloud fits the existing architecture | Grafana Cloud fits the existing architecture |
| Self-hosted environment | Your team can operate Kibana plus the required Elasticsearch infrastructure | Your team wants a separate visualization layer and can operate its telemetry backends independently |
Conclusion
Kibana and Grafana solve overlapping observability problems through different architectures. Kibana is typically the more cohesive choice when Elasticsearch is already the central telemetry platform and engineering teams need tightly integrated search and investigation workflows. Grafana is particularly valuable when teams want to preserve multiple monitoring backends and query them through a shared dashboard and alerting layer. The right decision should account for data sources, querying workflows, deployment model, security requirements, operational complexity, and total cost.
If you’re evaluating how monitoring and observability should fit into a broader cloud architecture, Scopic can help you design, deploy, and manage secure cloud infrastructure aligned with your application’s operational requirements through our cloud services. Contact us to discuss your project.
FAQ: Kibana vs Grafana
Is Grafana better than Kibana?
Neither platform is universally better. Kibana is usually the more natural choice when Elasticsearch is already the center of the observability environment and teams need tightly integrated search and investigation workflows. Grafana is often a stronger fit when dashboards and alerts must combine telemetry from several independent sources. The deciding factor should be your data architecture and operational workflows rather than visualization features alone.
Is Grafana a good Kibana alternative?
Grafana can be a strong Kibana alternative when the main requirement is visualization, exploration, and alerting across multiple data sources. It can query Elasticsearch directly for logs and metrics while also connecting to systems such as Prometheus. However, Grafana does not reproduce every Kibana workflow or Elastic management capability, so teams heavily invested in Elasticsearch may still benefit from retaining Kibana.
Can Grafana use Elasticsearch?
Yes. Grafana includes a preinstalled Elasticsearch data-source plugin that can query and visualize logs and metrics stored in supported Elasticsearch versions. It supports Lucene queries, Elasticsearch Query DSL, ES|QL, annotations, and certain alerting workflows. This allows Elasticsearch data to appear alongside telemetry from other Grafana data sources without moving it to another database.
Is Kibana only for logs?
No. Kibana and Elastic Observability support logs, metrics, and traces. Kibana’s historical association with Elasticsearch logging can make it appear log-focused, but current Elastic workflows include dedicated experiences for metrics, traces, APM, infrastructure monitoring, dashboards, and alerting. The more useful distinction is that Kibana works around data stored in Elasticsearch rather than being restricted to a particular telemetry signal.
Which is better for Prometheus, Kibana or Grafana?
Grafana generally provides the more direct Prometheus workflow because its Prometheus data source is preinstalled and queries Prometheus using PromQL. Elastic can also work with Prometheus metrics, but the usual model is to collect or send those metrics into Elasticsearch and then analyze them through Elastic Observability and Kibana. The better option therefore depends on whether Prometheus remains the primary metrics backend or Elastic is the centralized observability platform.
This guide was written by Scopic Team
Scopic provides quality and informative content, powered by our deep-rooted expertise in software development. Our team of content writers and experts have great knowledge in the latest software technologies, allowing them to break down even the most complex topics in the field. They also know how to tackle topics from a wide range of industries, capture their essence, and deliver valuable content across all digital platforms.